Designing an Adaptive Email Experience at JPMC
My Role: Lead UX Designer
Team: UX Researcher, Product Manager, Engineer
Duration: 3 months
Project Overview
Due to the sensitive nature of this cybersecurity project, only limited details are shared here.
This project focused on redesigning a complex enterprise risk-reporting email used by managers, application owners, and leadership to monitor security insights and prioritize follow-up actions. Partnering closely with a UX researcher, I conducted user interviews and usability testing to better understand how different audiences consumed the email and what information they valued most. Working collaboratively with a product manager and engineer, I balanced user needs, business goals, and the technical constraints of email development to redesign the experience. The result was a series of tailored design concepts that improved information hierarchy, reduced cognitive load, and prioritized the most relevant content for each audience.

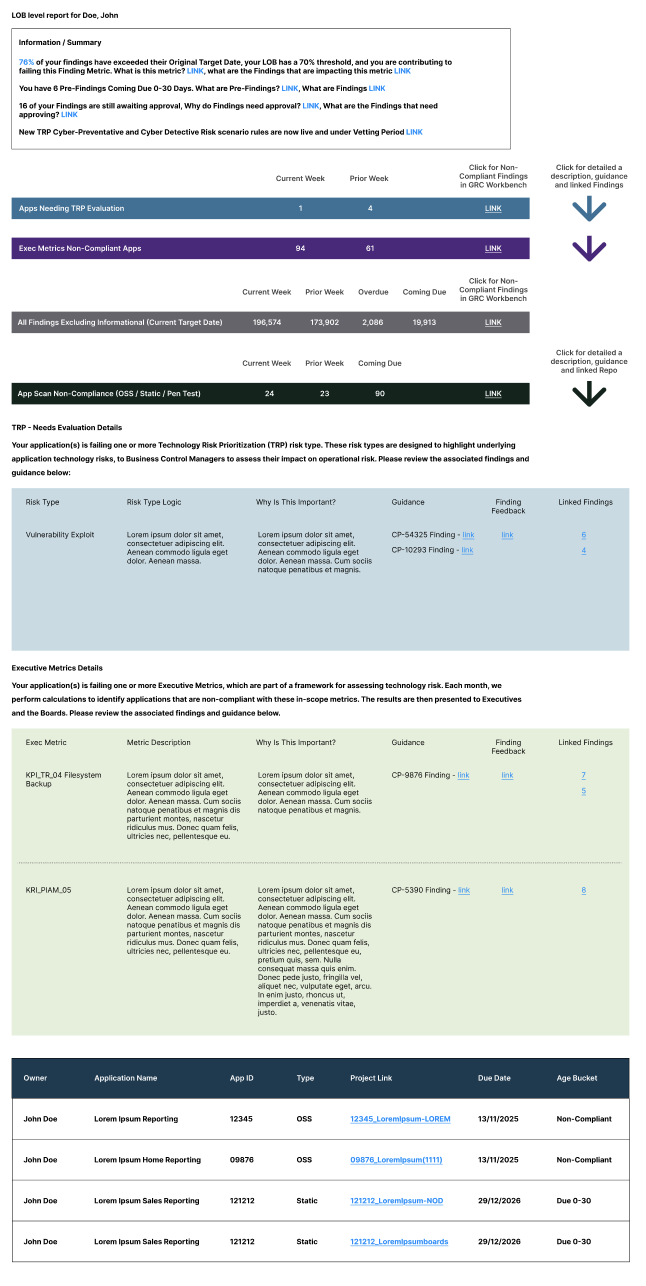
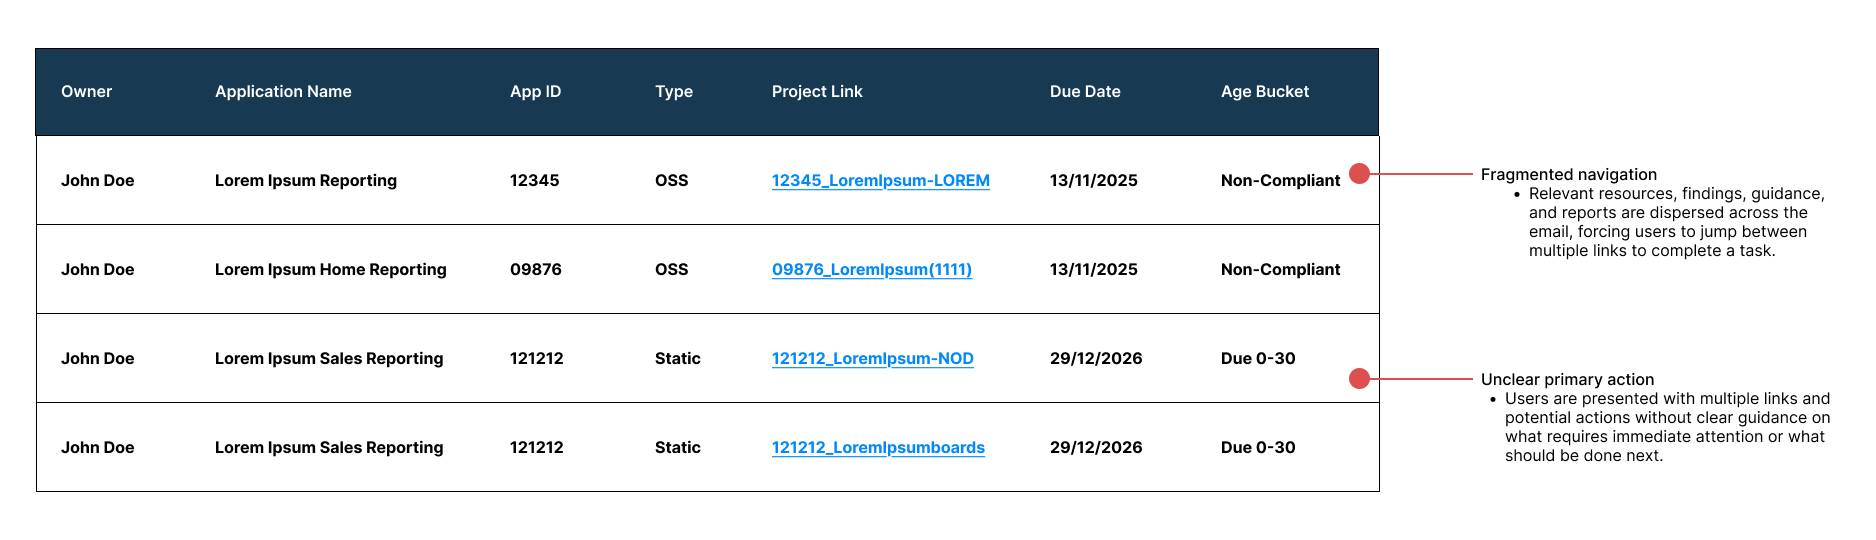
Through user interviews and usability testing, we uncovered that the challenge extended beyond visual design. The email was attempting to meet the needs of several audiences, each with different goals and priorities. As a result, users struggled to quickly find the information most relevant to them. The following are user pain points we uncovered during research:
Different users opened the email with different goals
Managers, application owners, and leadership each looked for different information, yet everyone received the same experience. The email lacked a clear strategy for prioritizing content based on user needs.
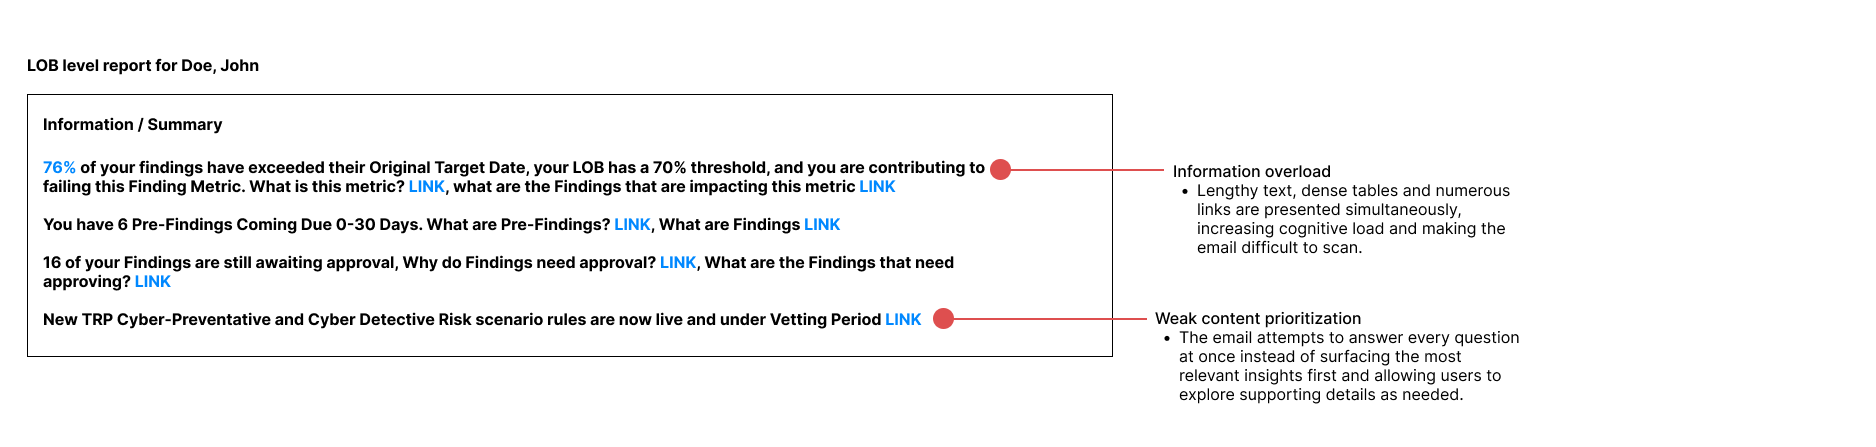
Information overload
Users felt overwhelmed by the volume of information presented, making the email difficult to scan and digest.
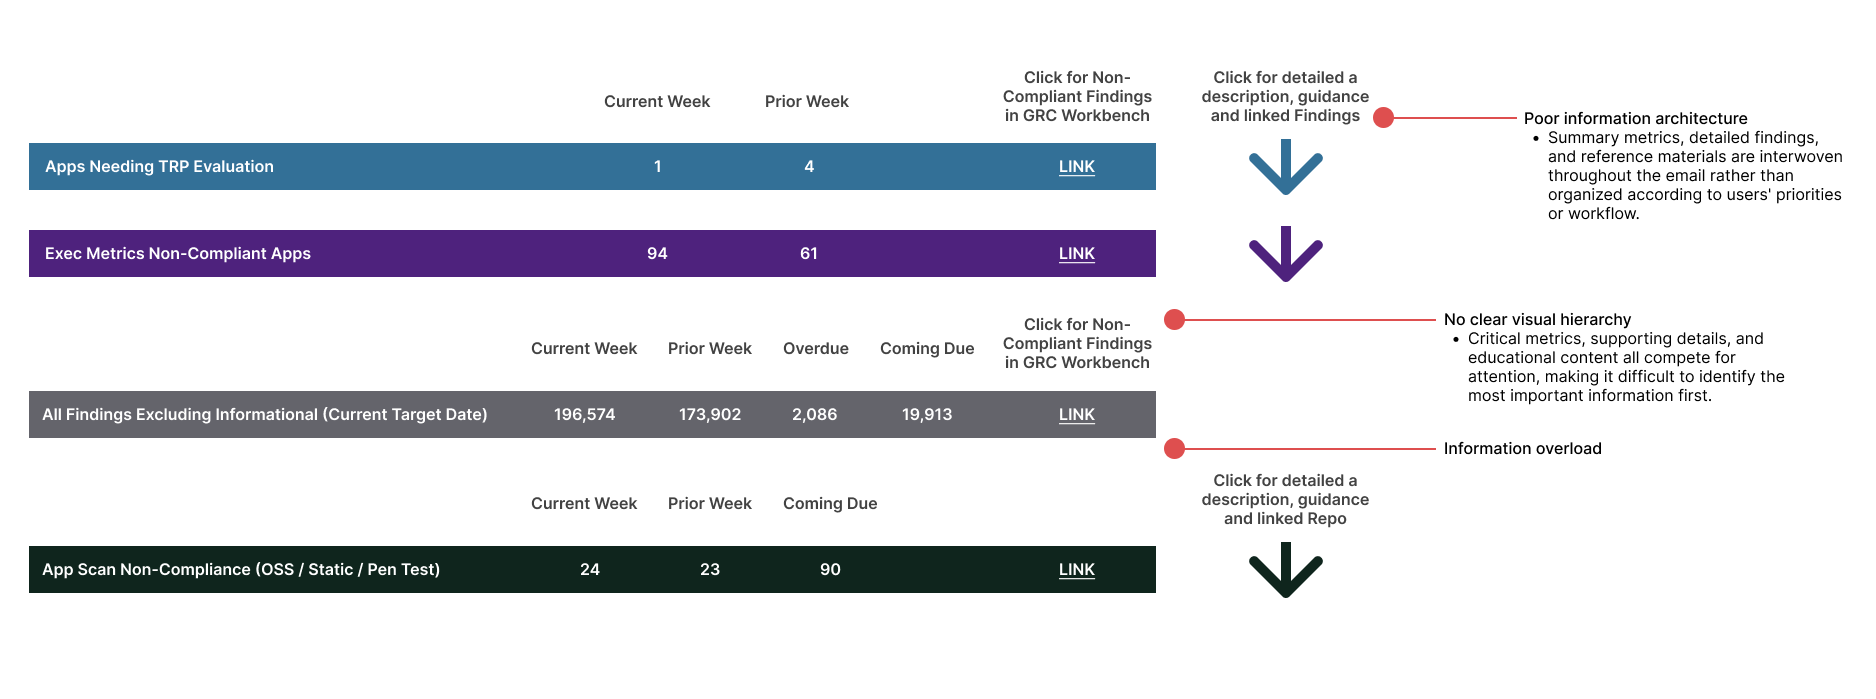
Critical insights were buried
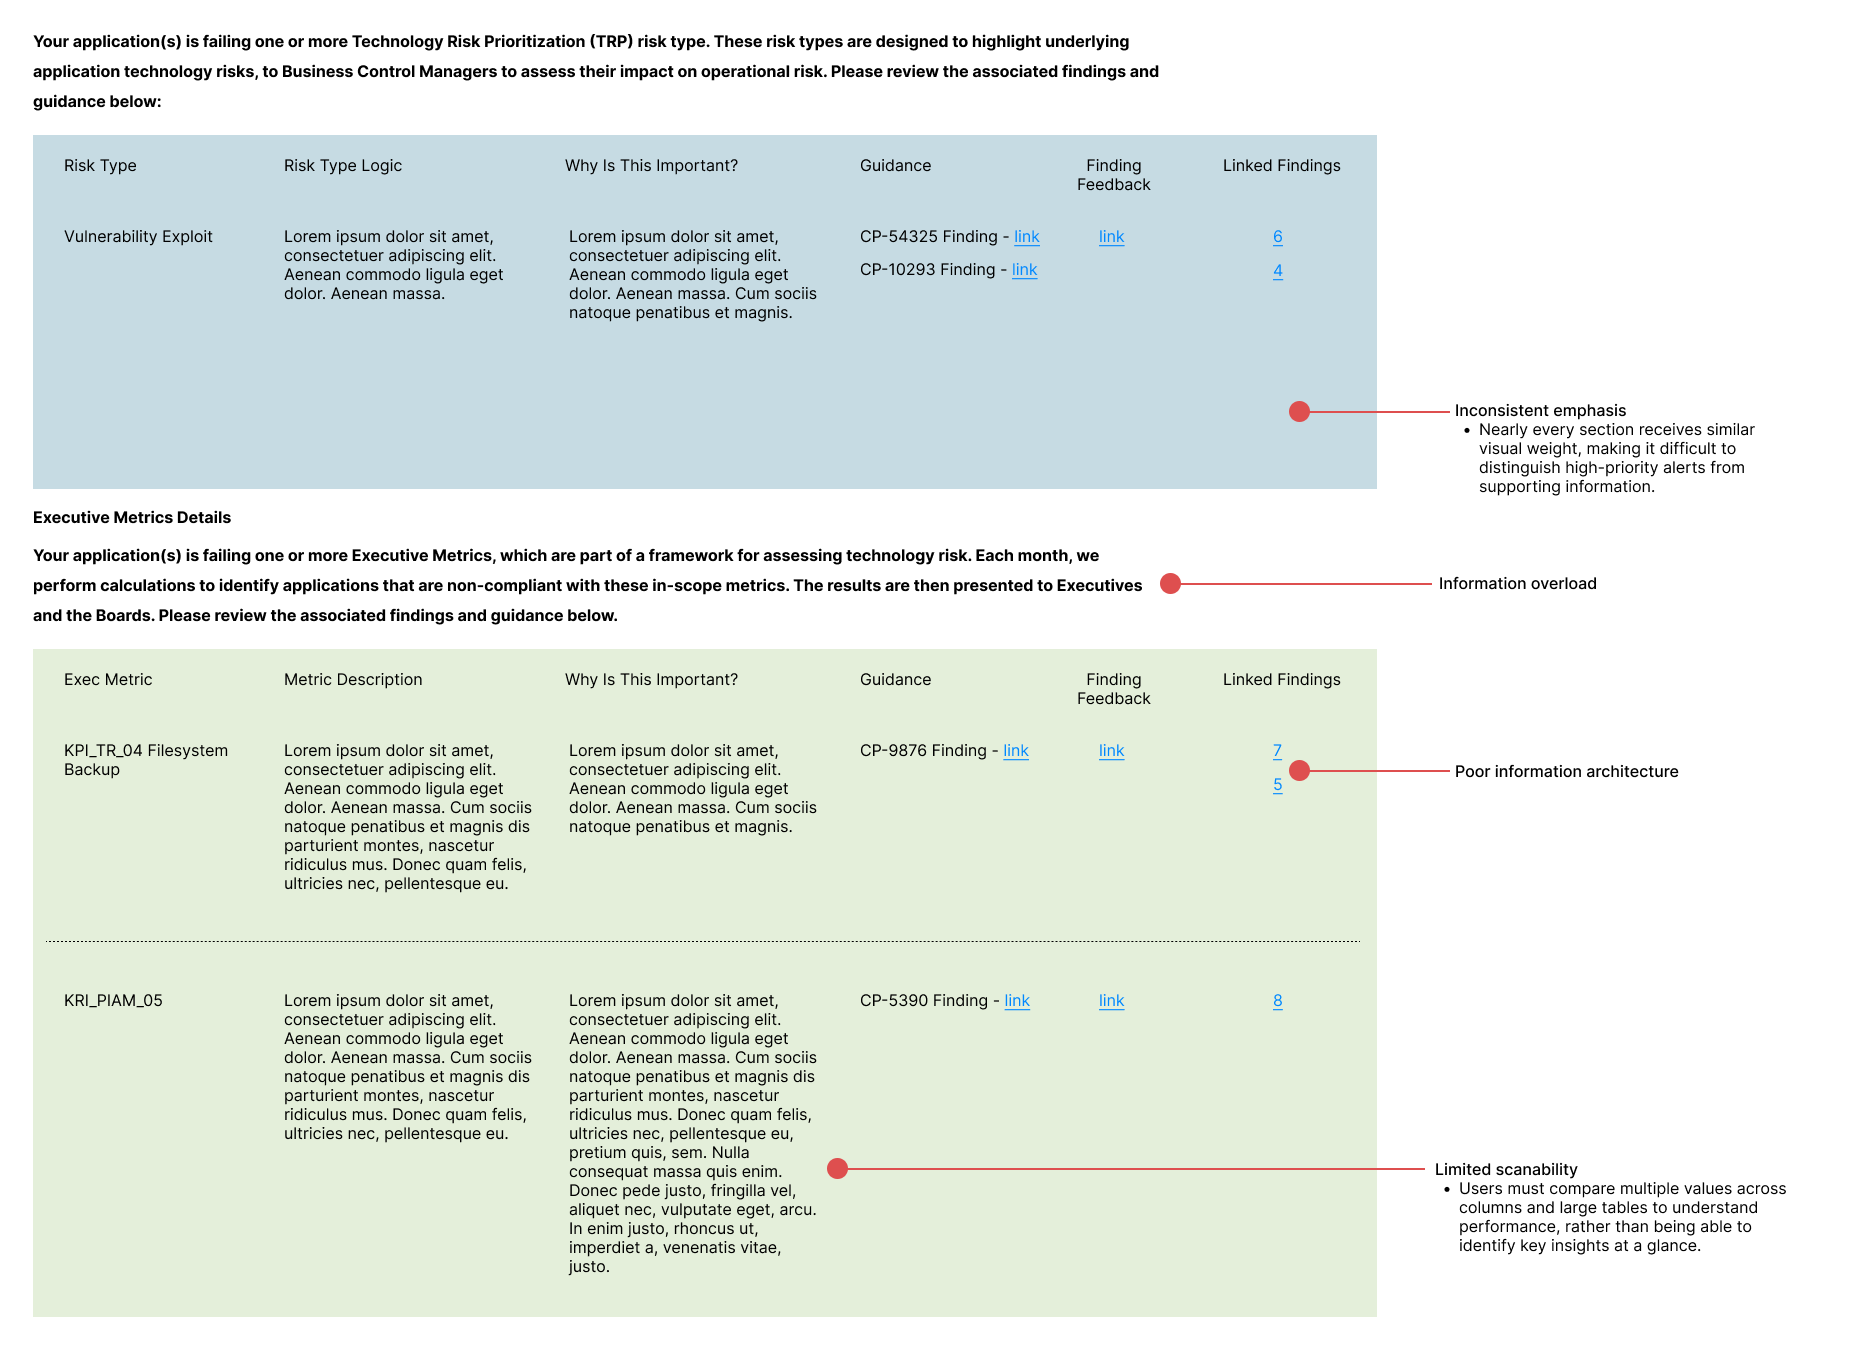
Important metrics and high-priority updates were lost within dense tables and lengthy supporting content.

User Pain Points
Design Challenge
How do you redesign a complex, data-heavy email so the most important information is immediately actionable without overwhelming the user?
Prioritized content based on user goals
Rather than treating every piece of information as equally important, I first identified what each audience needed to accomplish after opening the email. This allowed me to prioritize content according to user intent rather than business requirements alone.
Key outcome
Defined content priorities for managers, application owners, and leadership.
Explored multiple layouts tailored to each audience's needs.
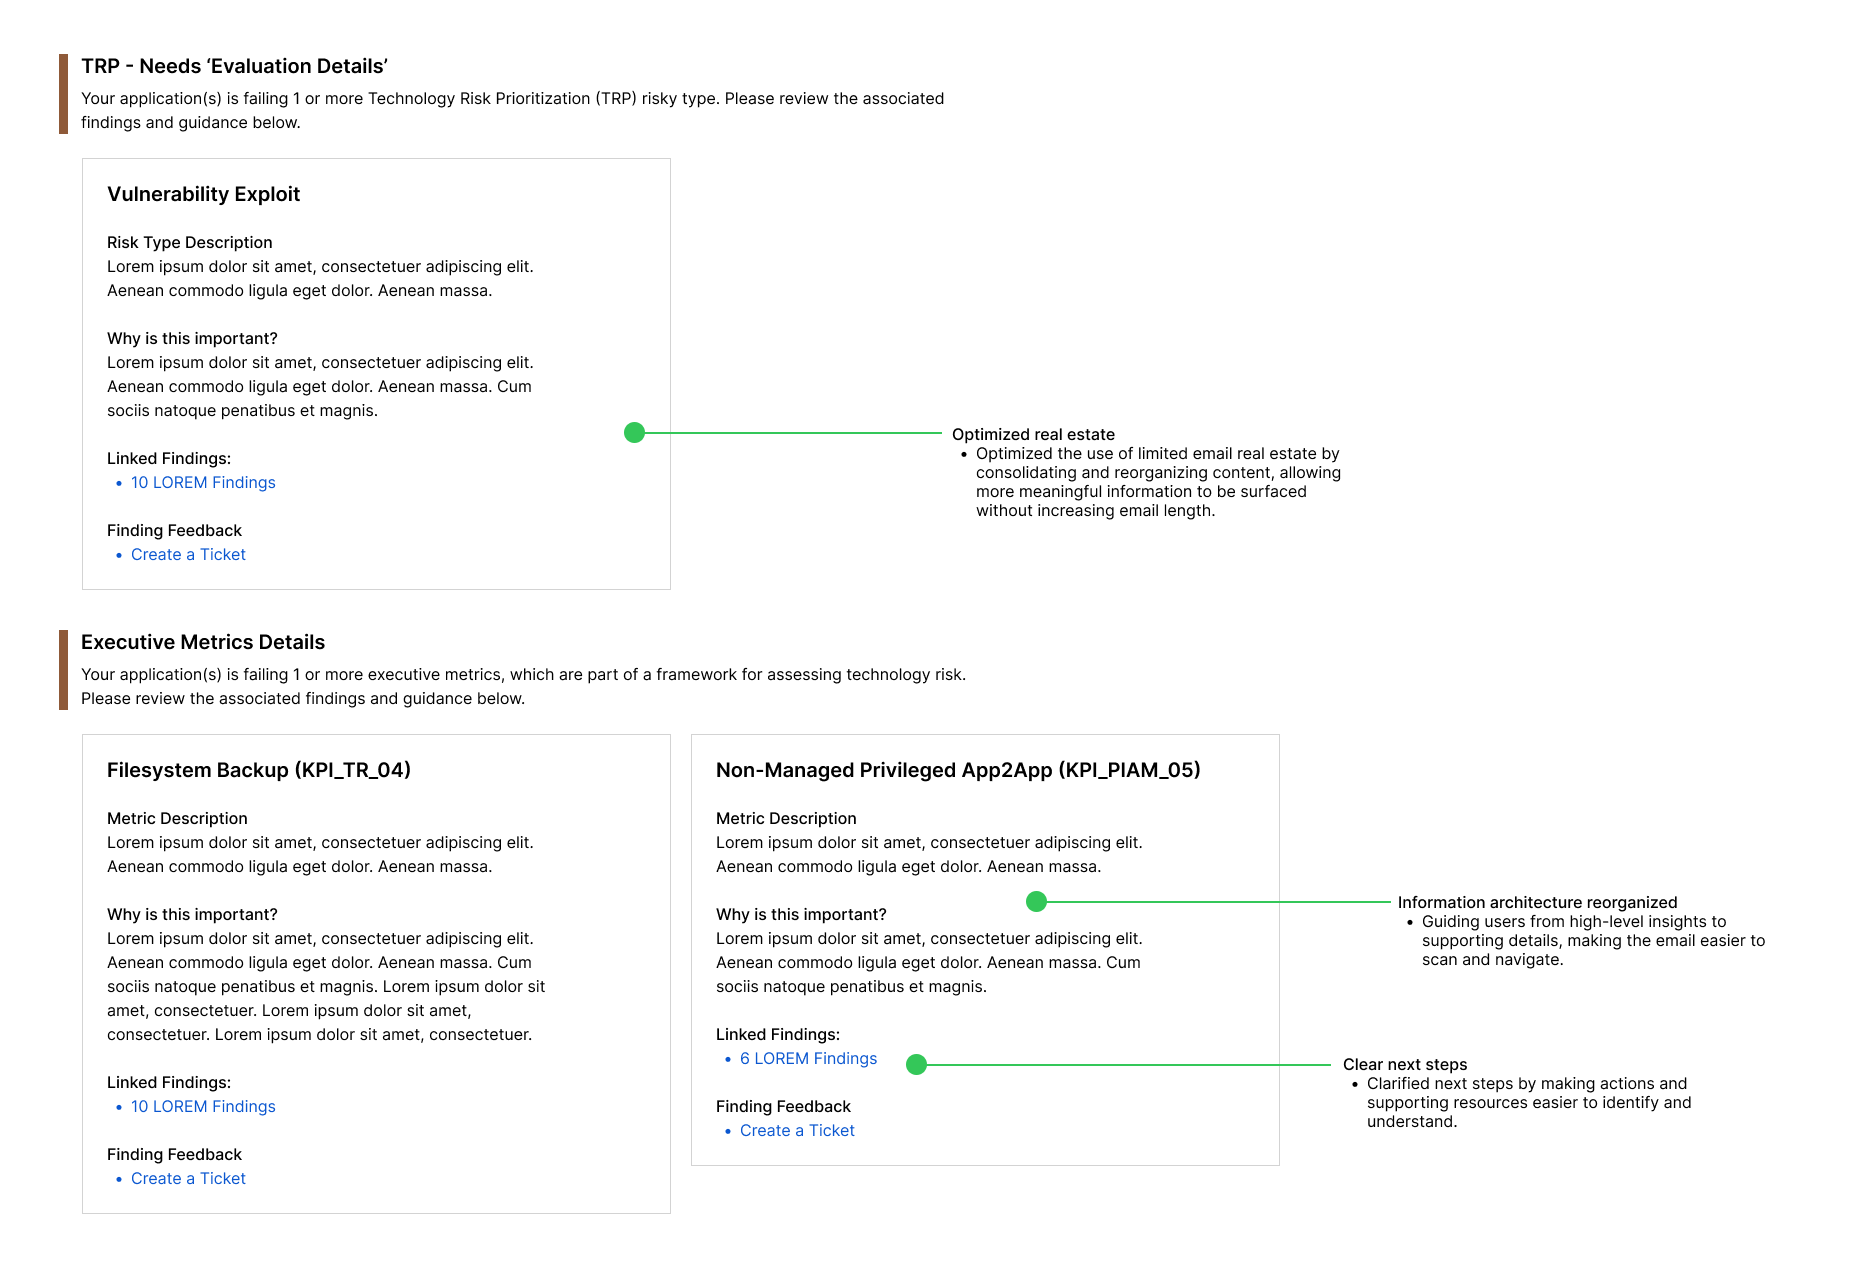
Reorganized the information architecture
With content priorities established, I restructured the email to create a clear hierarchy. Instead of presenting everything at once, I organized information from high-level insights to supporting details, allowing users to quickly assess status before diving deeper.
Design decisions
Surfaced critical metrics first.
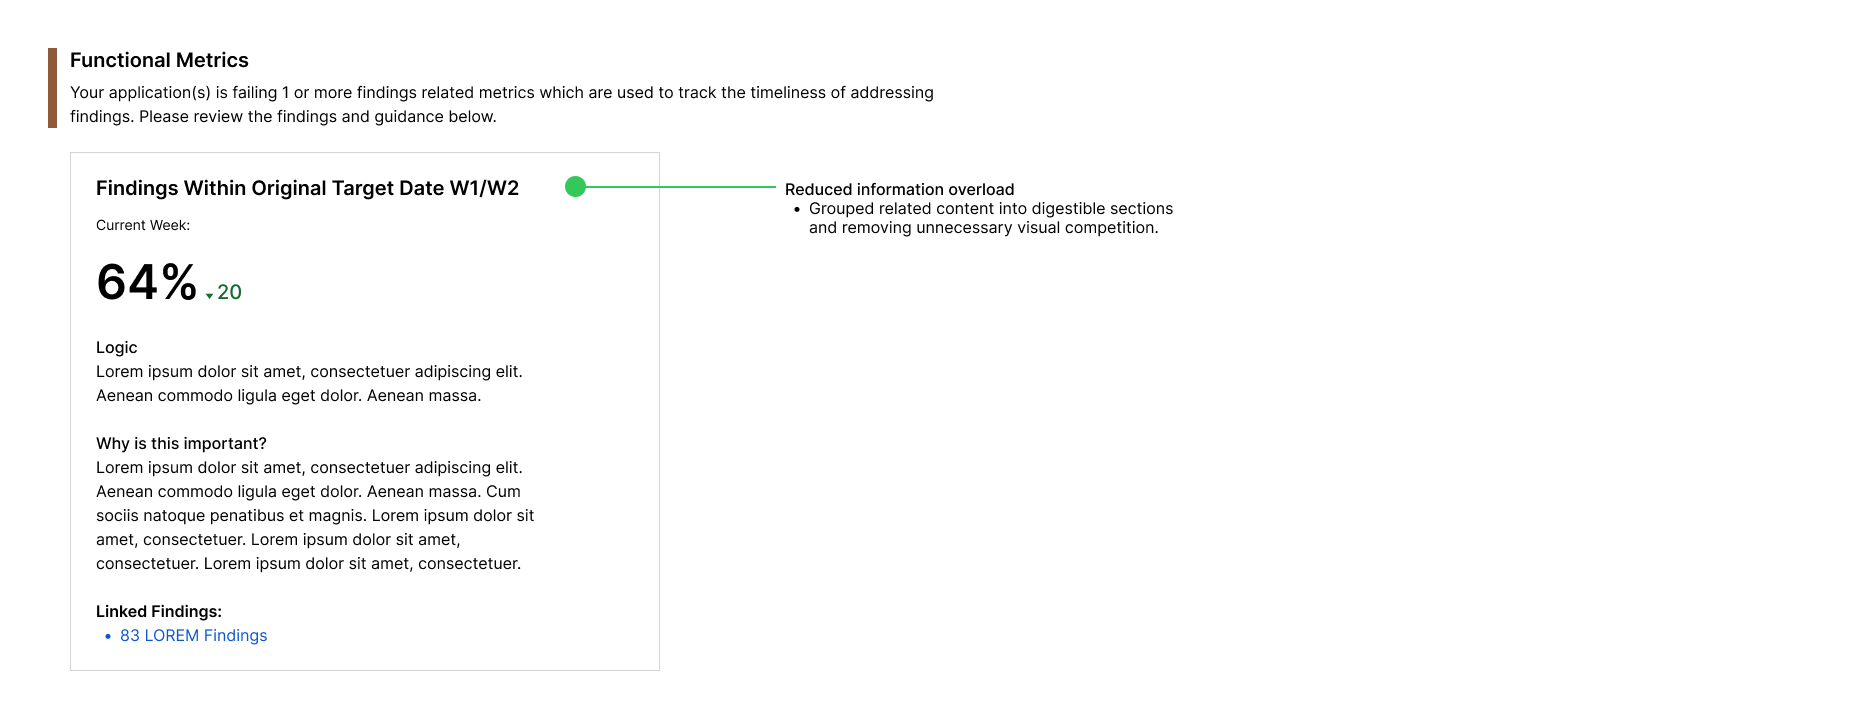
Grouped related information into meaningful sections.
Moved secondary information lower in the email.
Reduced unnecessary visual competition.
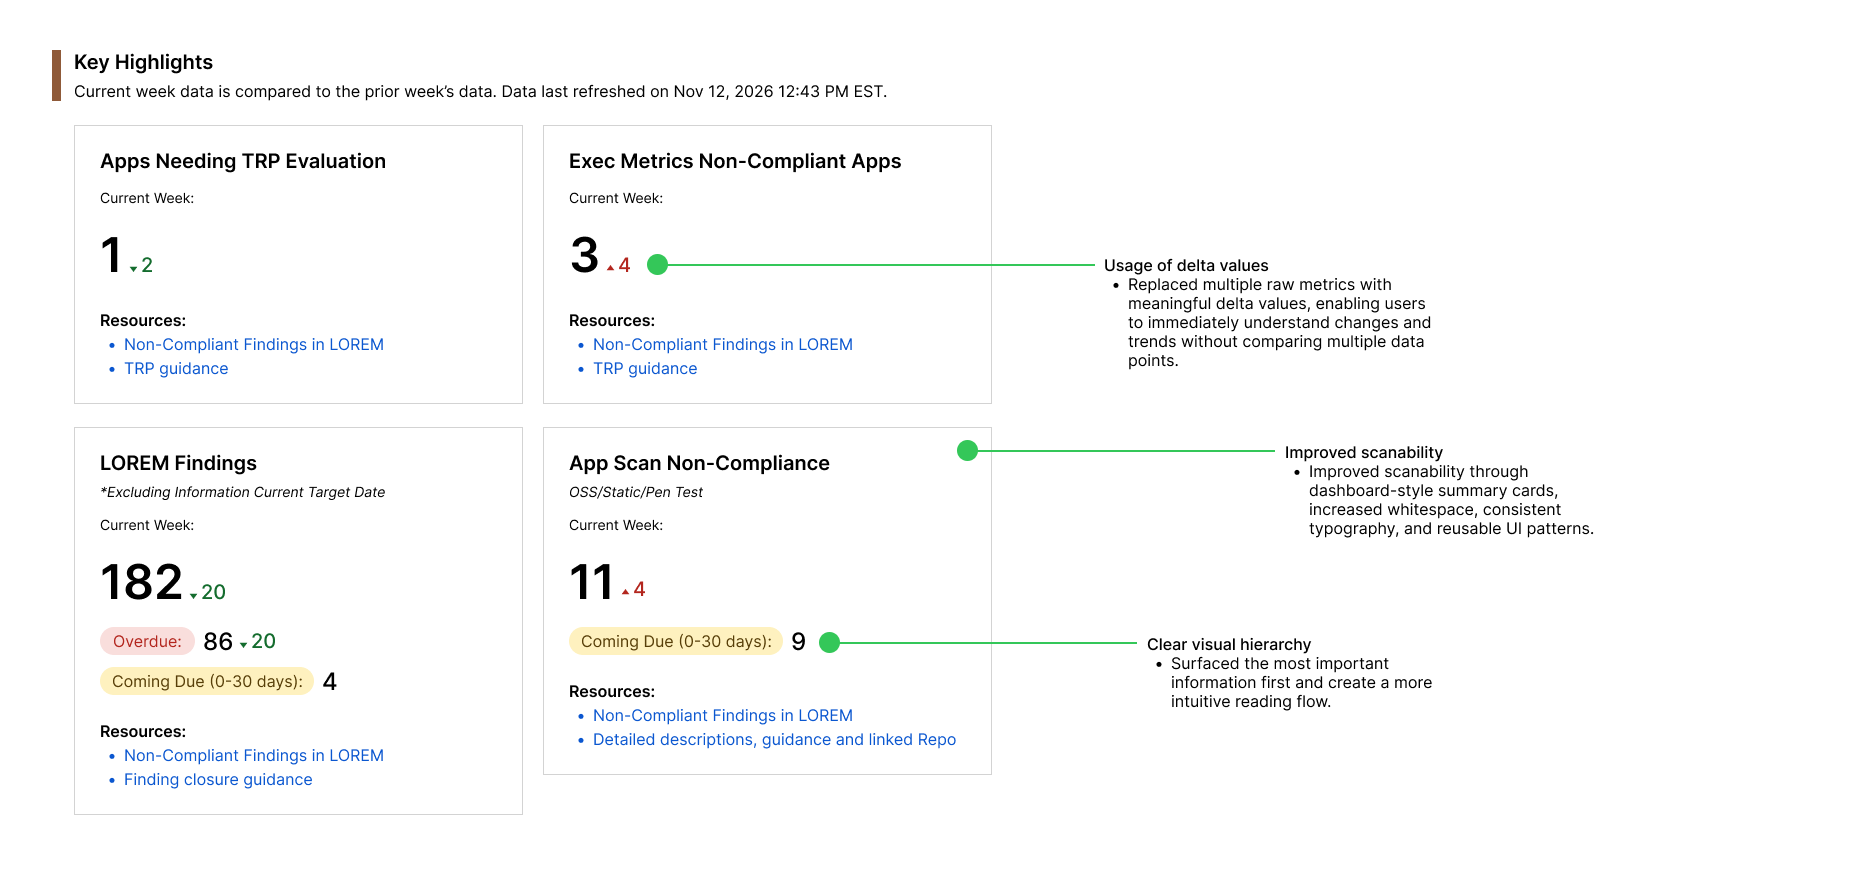
Improved scanability through visual hierarchy
I redesigned the layout to support how users naturally scan emails. Typography, spacing, color, and component hierarchy were used intentionally to draw attention to the most important information.
Design decisions
Introduced dashboard-style summary cards.
Increased whitespace between sections.
Used consistent typography and color to establish hierarchy.
Reduced reliance on dense tables.
Iterated through cross-functional collaboration
Throughout the project, I partnered closely with the UX researcher, product manager, and engineering team. Research findings informed each design iteration, while ongoing collaboration ensured the final concepts aligned with business goals and the technical constraints of HTML email development.
Collaboration highlights
Validated concepts with users through usability testing.
Iterated based on stakeholder feedback.
Balanced user needs with engineering constraints.
Refined designs through multiple rounds of feedback.
Design Process
The Original Design
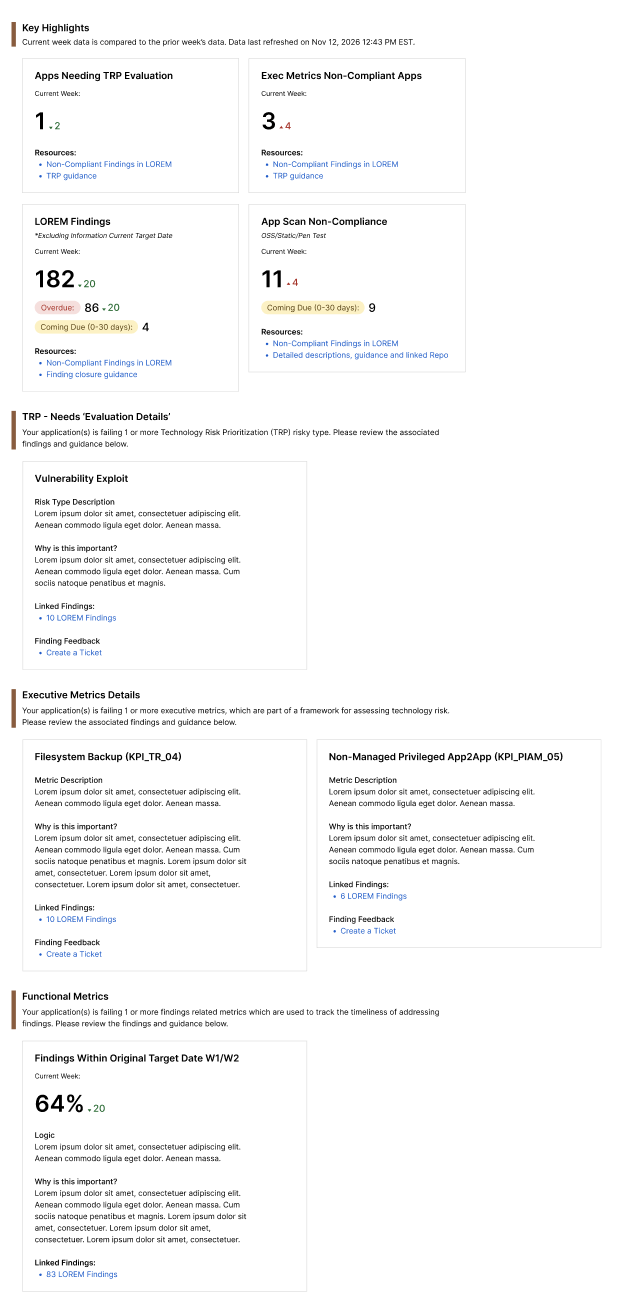
The Final Design
A redesigned email experience that helps users quickly understand what matters most and determine the appropriate next steps.
Not pictured due to sensitive nature: the multiple email variations designed to prioritize the information most relevant to managers, application owners, and leadership.